- Type
- Lesson plan
- Subject
- Math
- Topics
- Math & Economics
- Grade
- Primary (Grades 3-5)
- Ages
- Ages 8-10
How do bar graphs help us organize, compare, and understand competition data?
Overview
Bar graphs allow students to visualize data, spot patterns, and make quick comparisons between categories. By translating raw quantities into visual representations, learners can easily compute differences between values and understand the core concept that bar graphs help us process data efficiently.
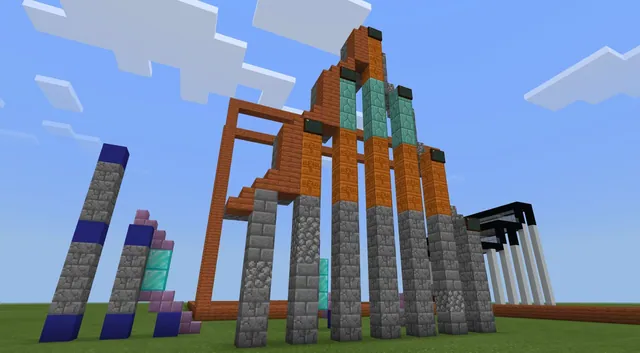
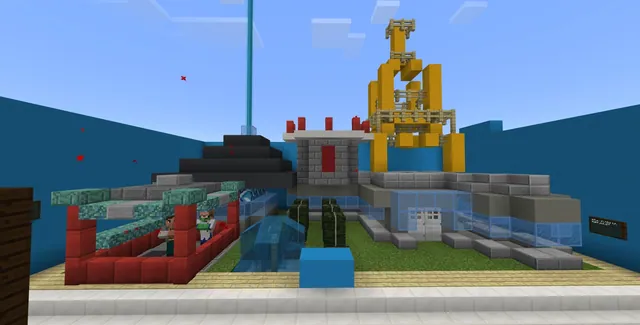
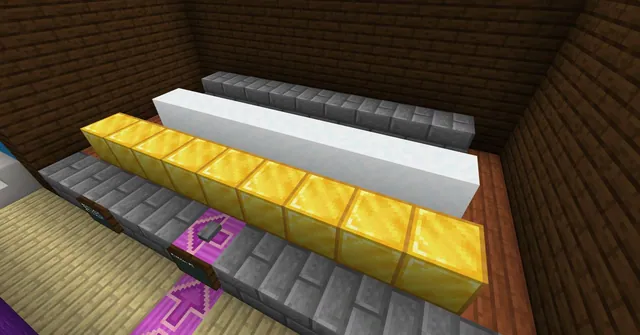
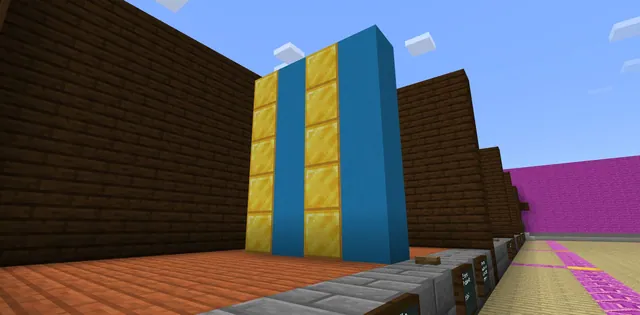
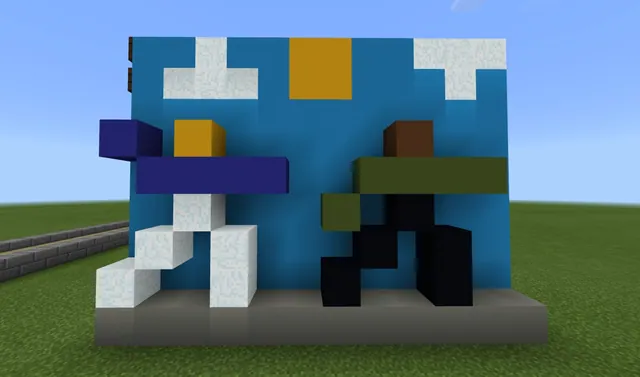
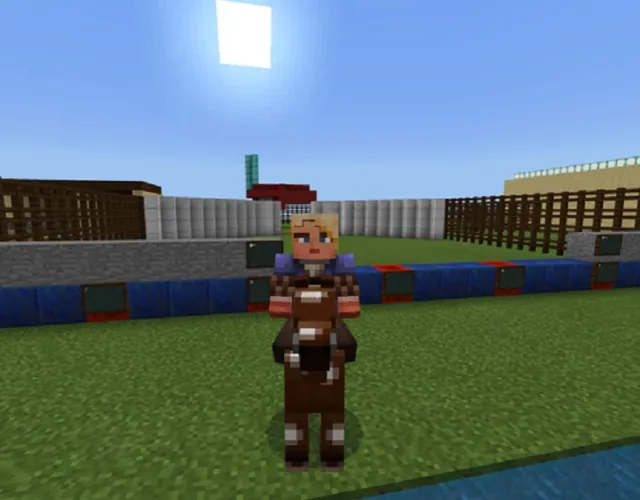
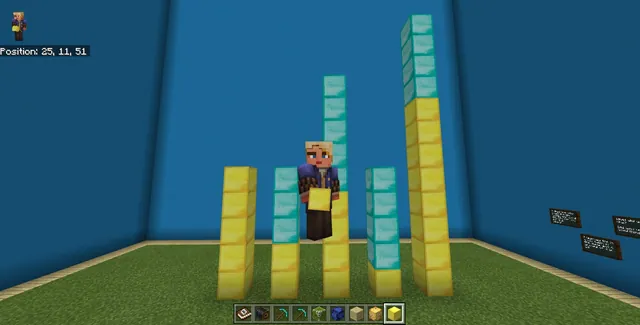
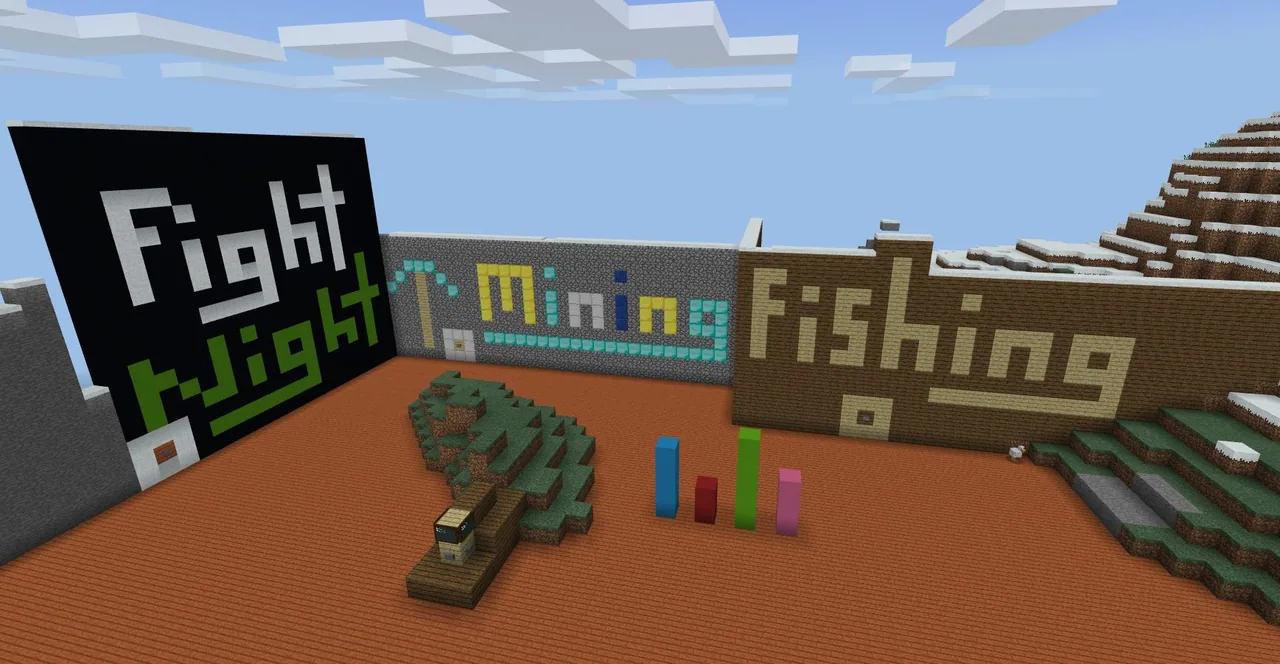
Using the Survival Olympics World, students divide into five teams to compete across three timed mini-games: fishing, mining, and mob fighting. After each event, players convert their gathered items into points, record the results in spreadsheets, and create tiered bar graphs showing individual yields, team totals, and overall standings.
Learning objectives
By the end of this lesson students will be able to:
- Record item quantities and calculate earned points during timed Minecraft challenges.
- Generate scaled bar graphs using spreadsheets to display individual, team, and class results.
- Solve comparison questions regarding differences between highest and lowest data values.
- Explain how bar graphs assist in processing and interpreting numerical information.
Blocks and items used in this lesson
 Fishing Rod
 Diamond Pickaxe
 Bow
 Rotten Flesh
 Ender Pearl
 Diamond
Key vocabulary
- Bar Graph
- A chart using rectangular bars to visually represent and compare data across categories.
- Data
- Facts, numbers, or item counts collected together for reference or analysis.
- Spreadsheet
- A digital document where data is arranged in rows and columns to make calculations and charts.
Before class
Lesson sequence
- Introduction and Concept Discussion
Present example bar graphs to the class. Discuss how graphs display differences and comparisons between categories. Once students recognize how charts make numbers easier to digest, introduce the core guiding concept: Bar Graphs Help Us Process Data.
- Event 1: Fishing Competition
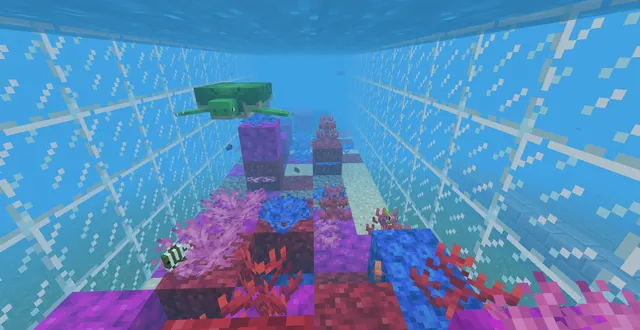
Review the fishing point values: Cod (1 point), Pufferfish (2 points), Salmon (3 points), and Tropical Fish (4 points). Press the Fishing button to teleport teams into the arena, providing each player with a boat and fishing rod. Run a five-minute timer.
When time expires, students enter their catches into the spreadsheet. Each student creates three bar graphs: their personal fish scores, their team member total scores, and a comparison of all five teams. Ask students which fish scored the most points and what difference exists between the highest and lowest scores.
- Event 2: Mining Competition
Explain the ore scoring rules: Coal (1 point), Iron (2 points), Gold (3 points), Lapis (4 points), and Diamond (4 points). Press the Mining button to give students diamond pickaxes, torches, and ladders before starting the five-minute timer.
Students record their ore counts into the spreadsheet and construct individual, team, and multi-team bar graphs. Guide analysis by asking how much coal and iron were gathered and how the top scores compare to the lowest.
- Event 3: Fight Night
Review mob drop points: Rotten Flesh (1 point), String (1 point), Bones (2 points), Gun Powder (3 points), Glass Bottles (4 points), and Ender Pearls (4 points). Press the Fight Night button to teleport players with swords, bows, and arrows, then start a seven-minute timer.
Students document their loot, generate the three levels of bar graphs, and analyze their graphs to determine which items generated the highest scores and how many 4-point items were collected.
- Debrief and Awards
Conclude the lesson by asking students for their thoughts on using spreadsheets and why bar graphs are useful tools. Compare the final cumulative graphs across all five teams and crown the winning team of the Survival Olympics.
Assessment: success criteria
- Accurate entry of item counts and scores into the Scorecard Spreadsheet.
- Successful generation of scaled bar graphs for individual scores, team totals, and class standings.
- Correctly calculated answers to comparative questions regarding score differences and item totals.
- Participation in the debrief discussing real-world applications of spreadsheets and bar graphs.
Differentiation
Provide the Example Fishing Bar Graph as a visual guide and assist students step-by-step with entering numbers into the spreadsheet.
Have advanced students write spreadsheet code or formulas, or peer-tutor classmates on creating digital charts.
Knowledge check
5 questions to check understanding after the lesson. Tap an answer to see if it is right; the score appears at the end.
1How many points does a Tropical Fish award during the fishing competition?
Answer: D. The fishing point system assigns Cod 1 point, Pufferfish 2 points, Salmon 3 points, and Tropical Fish 4 points.
2What is the Big Idea introduced at the start of the lesson?
Answer: B. The guiding ideas section explicitly states the Big Idea: 'Bar Graphs Help Us Process Data'.
3How long is the timer set for the Fight Night competition?
Answer: B. The source specifies setting a timer for seven minutes during the Fight Night activity.
4Which of these ores is worth 3 points during the mining event?
Answer: C. According to the mining scoring list, Coal is 1 point, Iron is 2 points, Gold is 3 points, and Lapis is 4 points.
5What three bar graphs do students construct after each mini-game round?
Answer: A. In each event, students make a graph of their own data, one for their team players' totals, and one comparing all teams.
Resources
- Lesson package (.zip)Everything the author attached to this lesson in one download.
- Rubric
- Scorecard Spreadsheet
- Example Fishing Bar Graph
- Lesson worldOpens the world page in Minecraft Education (sign-in with a school account may be needed).
Part of the Grade 3 Math curriculum
This is lesson 14 of 15 in Grade 3 Math.
- Algebra Architecture
- Building Word Problems
- Division Into Equal Numbers
- Finding the Unknown
- Fractions Pixel Art
- Fractions Steeplechase
- Liquid Measurements
- Make a Regrouping Video
- Measuring Landforms
- Repeated Addition with Parkour
- Round Numbers Video
- Shapes From Shapes
- Survival City Making Roads
- Survival Olympics Bar Graphs
- Two Step Word Problems
Frequently Asked Questions
What gear do students receive for the mining event?
When the mining button is pushed, students are teleported to the mine and given a diamond pickaxe, torches, and ladders.
How many teams participate in the Survival Olympics?
The lesson plan specifies dividing the class into five teams before logging into the world.
What supporting files accompany this lesson?
The lesson includes a Rubric, a Scorecard Spreadsheet, and an Example Fishing Bar Graph.
Adapted from Survival Olympics Bar Graphs by Minecraft Education on Minecraft Education, last updated Sep 16, 2023. This classroom version, the timings and the quiz were written by 9Minecraft Education.