- Type
- Lesson plan
- Ages
- Ages 8-13
- Duration
- about 60 min (suggested)
How does collecting more data change our understanding of an item's drop rate?
Overview
In this cross-curricular math and science lesson, students assist Archimedes by investigating whether item drops follow predictable patterns or pure chance. Working in survival mode, learners gather data from defeated mobs or harvested blocks to determine how frequently specific items appear.
Students record their trials and successes on a worksheet, translating raw counts into fractions, decimals, and percentages. By combining individual findings into a whole-class dataset, learners discover how larger sample sizes provide clearer insights into experimental probability.
Learning objectives
By the end of this lesson students will be able to:
- Record trial counts and drop events in a structured table while playing in survival mode.
- Calculate the experimental probability of drops as fractions, decimals, and percentages.
- Compare individual results with pooled class data to observe the impact of sample size.
- Document findings and observed items using the in-game Camera and Portfolio.
Blocks and items used in this lesson


Key vocabulary
- Probability
- The likelihood or chance of a particular event occurring.
- Sample Size
- The total number of observations or trials included in an investigation.
- Drop Rate
- The frequency or percentage chance that an item appears after breaking a block or defeating a mob.
Before class
Lesson sequence
Suggested timing: about 60 minutes in total.
- Briefing with Archimedes10 min
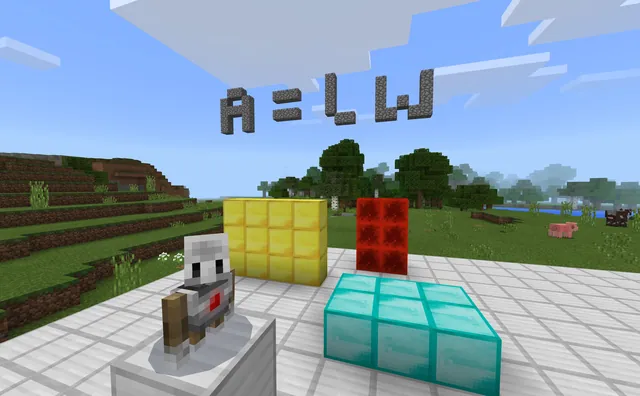
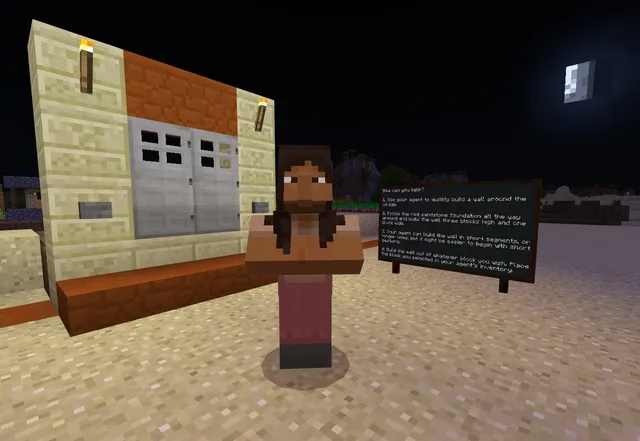
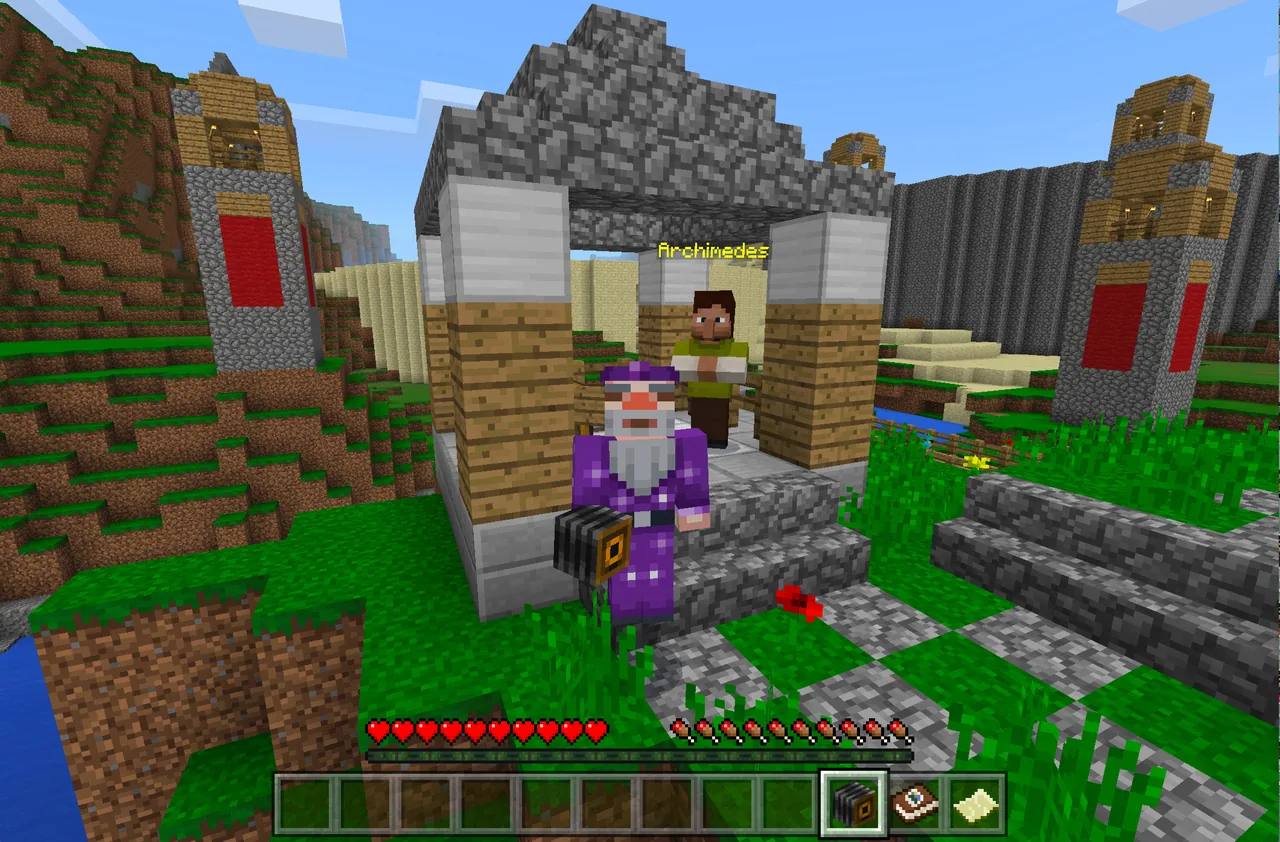
Introduce the historical scenario where Archimedes needs help examining drop ratios after defending Syracuse. Have students interact with Archimedes in-game to identify their mission, select their target items (such as flint from gravel, seeds from grass, bones from skeletons, or rotten flesh from zombies), and organize into pairs.
- Data Collection in Survival25 min
Students venture out in survival mode with cheats disabled. Pairs track each action on their calculation sheet, logging every block broken or mob defeated alongside the quantity of items dropped. Students also photograph their target items with the Camera to compile in their Portfolio with descriptive captions.
- Calculating Individual Drop Rates15 min
Pairs conclude gathering and compute their individual drop probabilities. Students express their drop frequency first as a fraction of items dropped per blocks broken or mobs defeated, and then convert that value into both a decimal and a percentage.
- Class Pooling and Reflection10 min
Combine individual pair data onto a central class board to form a much larger sample size. Discuss how the expanded dataset affects the overall percentage and whether the drop rates become more consistent as total trials increase.
Assessment: success criteria
- Accurately tabulates total attempts versus successful item drops on the calculation sheet.
- Correctly converts drop ratios into fractional, decimal, and percentage representations.
- Contributes pair data to the class pool and explains how the combined sample size influences probability.
- Creates a Portfolio containing captured images and captions representing the investigated items.
Differentiation
Have learners focus on easily renewable, non-hostile targets such as breaking grass for seeds or digging gravel for flint rather than hunting mobs.
Ask advanced learners to compare the experimental drop percentages of two distinct items and formulate a hypothesis about which has a lower programmed drop rate.
Knowledge check
5 questions to check understanding after the lesson. Tap an answer to see if it is right; the score appears at the end.
1What initial items do students receive at the start of the activity?
Answer: B. The source specifies that students begin their investigation equipped with a Camera, Portfolio, and Map.
2What is the primary mathematical purpose of combining all student data together?
Answer: C. Pooling results creates a larger sample size, allowing students to observe how increased data points affect probability calculations.
3Which game mode and setting restriction must students use during the experiment?
Answer: C. The instructions state that students play in survival mode with cheats disabled to collect authentic drop data.
4Which pair of targets and drops is mentioned as an example in the lesson?
Answer: C. The lesson lists flint from gravel, seeds from grass, bones from skeletons, and rotten flesh from zombies as sample items.
5In what order are students instructed to express their calculated drop rates?
Answer: B. The source directs students to determine items dropped per blocks broken in fractional form first, followed by percentage and decimal conversions.
Resources
- Lesson package (.zip)Everything the author attached to this lesson in one download.
- What's the Probability Worksheet PDFWhat's the Probability Worksheet PDF
- What's the Probability Worksheet DocWhat's the Probability Worksheet .docx
Frequently Asked Questions
Do I need a custom world download to run this lesson?
No custom world download is required. You can host any standard survival world, ensure cheats are turned off, and place a pressure plate at spawn to revoke World Builder status.
What should students do if night falls and survival becomes too difficult?
Pairs struggling with hostile mobs like skeletons or zombies can redirect their investigation to daytime tasks, such as breaking grass for seeds or shoveling gravel for flint.
Adapted from What's the Probability by Mark Grundel on Minecraft Education, last updated Mar 26, 2018. This classroom version, the timings and the quiz were written by 9Minecraft Education.