- Type
- Lesson plan
- Ages
- Ages 8-13
How does the size of a sample affect the reliability of conclusions drawn about a larger environment?
Overview
In scientific research and statistics, measuring every single element of a large area is often impossible. Instead, scientists rely on representative samples to infer the characteristics of an entire environment, learning that larger sample sizes provide far more dependable conclusions.
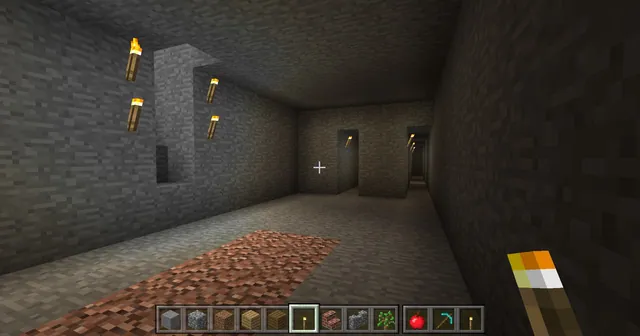
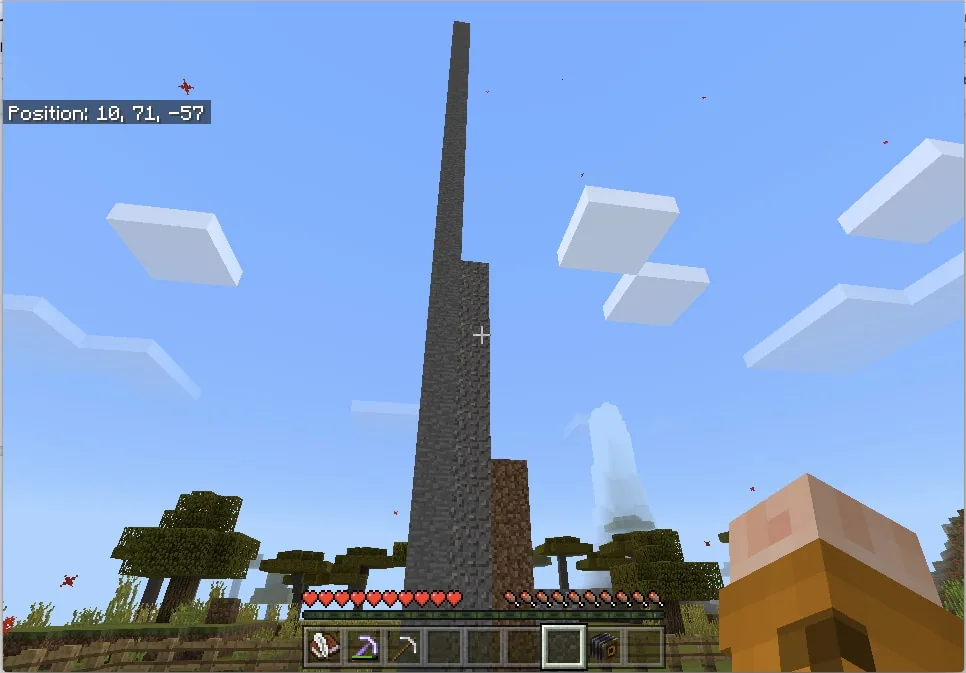
In this lesson, students take a vertical core sample of a designated zone by digging straight down 50 blocks with a Silk Touch pickaxe. They represent their findings visually as 3D block towers, convert their raw counts to percentages, and compare their single-sample data against pooled class results displayed on a circle graph.
Learning objectives
By the end of this lesson students will be able to:
- Formulate a hypothesis regarding the material composition of a designated region.
- Construct a physical 3D bar plot using gathered blocks to represent sample data.
- Convert raw block frequencies out of 50 into accurate percentages.
- Analyze how expanding the sample size through pooled class data improves reliability.
Blocks and items used in this lesson


Key vocabulary
- Core Sample
- A vertical column of material extracted from the ground to examine what lies beneath the surface.
- Sample Size
- The total number of individual observations or measurements taken in an experiment.
- Reliability
- The extent to which an experiment or sampling method gives dependable and repeatable results.
Before class
Lesson sequence
- Volume Calculation and Journaling
Students log into the world, take a writeable book from a starting chest, and calculate the total number of blocks in a 50x50x50 region directly on a journal page.
- Hypothesis and Core Sampling
Learners teleport to the assigned study region, record a prediction about its subterranean makeup, and retrieve a Silk Touch pickaxe from a chest. Each student selects a random spot and digs straight down 50 blocks until dropping into an underground room.
- Inventory Reconciliation
In the underground chamber, students count their inventory to verify they hold 50 blocks. If air gaps reduced their block count, they retrieve glass blocks from trapped chests to substitute for empty space.
- Data Visualization Towers
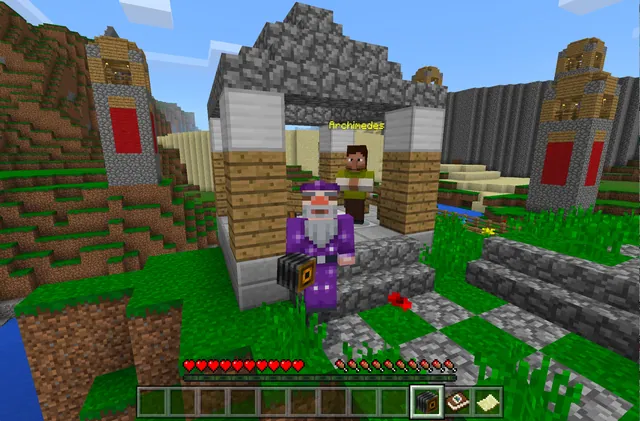
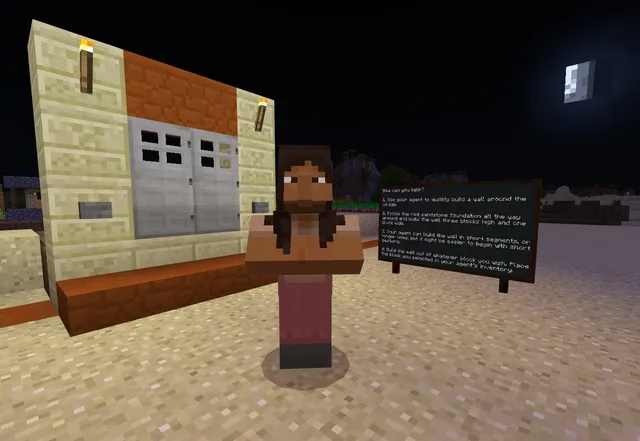
Students use a teleport station to enter the plot area, where they speak with the Helper NPC to receive flight, fall damage protection, and a camera. Students construct adjacent 1x1 towers for each material collected to create a physical bar graph and capture a photo.
- Class Data Pooling and Reflection
Students speak to the Survey Taker NPC to submit their numbers. The teacher compiles the data onto a circle graph, prompting students to compare their personal 50-block sample against the aggregated class findings to assess reliability.
Assessment: success criteria
- Accurate calculation of total blocks in a 50x50x50 region in the student journal.
- Correct conversion of block tallies out of 50 into percentages.
- Accurate physical construction of 1x1 block towers matching collected sample inventory.
- Completion of the summary document using recorded journal observations and class data.
Differentiation
Provide a scaffold reminding students that multiplying any block count out of 50 by two yields its percentage.
Challenge learners to calculate what fraction and percentage of the total 50x50x50 study area their individual 50-block sample represents.
Knowledge check
5 questions to check understanding after the lesson. Tap an answer to see if it is right; the score appears at the end.
1What general rule about data reliability does this lesson demonstrate?
Answer: A. Combining class data expands the sample size, providing a more reliable picture of the region than a single sample.
2Why is the pickaxe given to students enchanted with Silk Touch?
Answer: B. Silk Touch preserves the original block type so students can accurately count true underground composition.
3What do students collect from the trapped chest if their sample has fewer than 50 blocks?
Answer: C. Glass blocks serve as physical stand-ins for underground air pockets encountered during the dig.
4How do students physically display their data in the build area?
Answer: C. Students build adjacent single-column towers of each material to form a three-dimensional bar plot.
5What assistance does the Helper NPC provide in the plotting zone?
Answer: B. The Helper NPC enables flight, turns off fall damage, and gives students a camera to document their tower graphs.
Resources
- Lesson package (.zip)Everything the author attached to this lesson in one download.
- Core Sample Presentation TemplateStudents can use this PowerPoint template to present their findings.
- Core Sample Excel TemplateStudents or teacher can use this Excel worksheet to automatically generate circle graphs that represent their samples.
- Sample Size and Sound Conclusion WorldDownload and open this world for the students to work in.
Frequently Asked Questions
Why are students told to dig straight down despite Minecraft survival conventions?
Digging straight down is usually avoided in survival play, but here it creates a controlled vertical core sample that drops students safely into a predetermined underground room.
How does this lesson connect fraction conversion to sample size?
Because each core sample is exactly 50 blocks, students easily convert their counts into fractions with a denominator of 50 and double the numerator to find the percentage.
Adapted from Sample Size/Sound Conclusions by Jordan Ullman on Minecraft Education, last updated Jun 29, 2022. This classroom version, the timings and the quiz were written by 9Minecraft Education.