- Type
- Lesson plan
- Ages
- Ages 8-18
How can we effectively communicate survey findings by constructing visual graphs and charts?
Overview
Data representation allows learners to transform raw numbers into clear visual stories. By collecting survey information across categories such as preferences or scientific measurements, students learn the fundamentals of organizing, analyzing, and communicating quantitative facts.Learning objectives
By the end of this lesson students will be able to:
- Gather survey data across at least three distinct categories using tally marks.
- Select an appropriate graph format—such as a horizontal bar chart, line graph, or pie chart—to represent numerical results.
- Construct and label a complete data chart in Minecraft, including titles, axes, numbers, and keys where appropriate.
Blocks and items used in this lesson


Key vocabulary
- Data
- Information or numbers gathered through observation, measurement, or questioning.
- Survey
- A method of gathering information from a group of people by asking questions.
- Tally Marks
- A visual counting system recorded in marks to keep track of numbers quickly.
- Horizontal Bar Chart
- A graph that uses sideways bars of varying lengths to compare categories.
- Axis
- A reference line on a graph, such as the horizontal X-axis or vertical Y-axis, used to measure values.
- Key
- An explanatory visual guide that shows what colors or symbols represent on a chart.
Before class
Lesson sequence
- Introduction and Survey Planning
Introduce the core concepts of data collection and visual representation. Guide students to select a survey topic with at least three categories, such as preferred subjects, favorite colors, or classroom temperatures.
- Data Collection
Students conduct their surveys by asking peers questions or taking measurements, recording each response carefully using tally marks.
- Chart Selection and Layout
Students evaluate their data totals and decide whether to build a horizontal bar chart, a line graph, or a pie chart. They determine what labels, axes, and keys will be needed to make the chart clear.
- Minecraft Construction
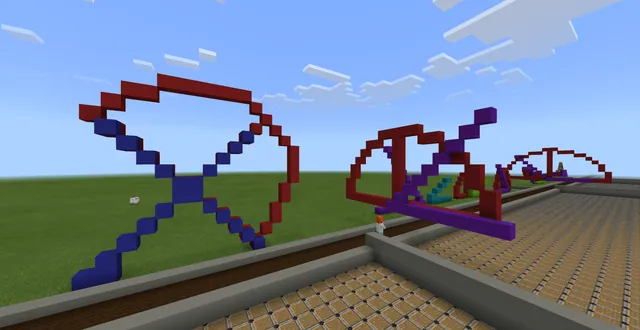
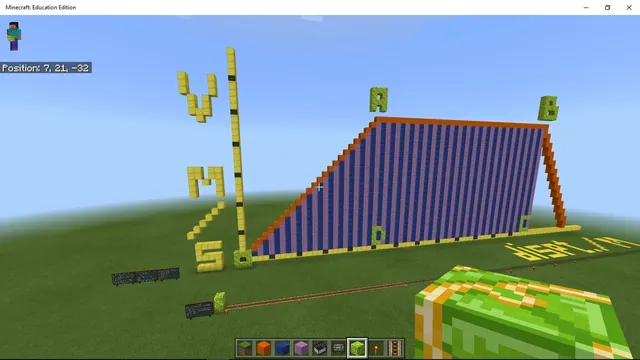
Students enter the downloadable Minecraft world to build their chosen graph. They use blocks to build values accurately and include titles, sub-titles, numbers, and axis labels.
- Review and Peer Evaluation
Learners view each other's charts in Minecraft to interpret the survey findings and verify that all required labels, axes, and keys are correctly positioned.
Assessment: success criteria
- The student surveyed and tallied data for at least three distinct categories.
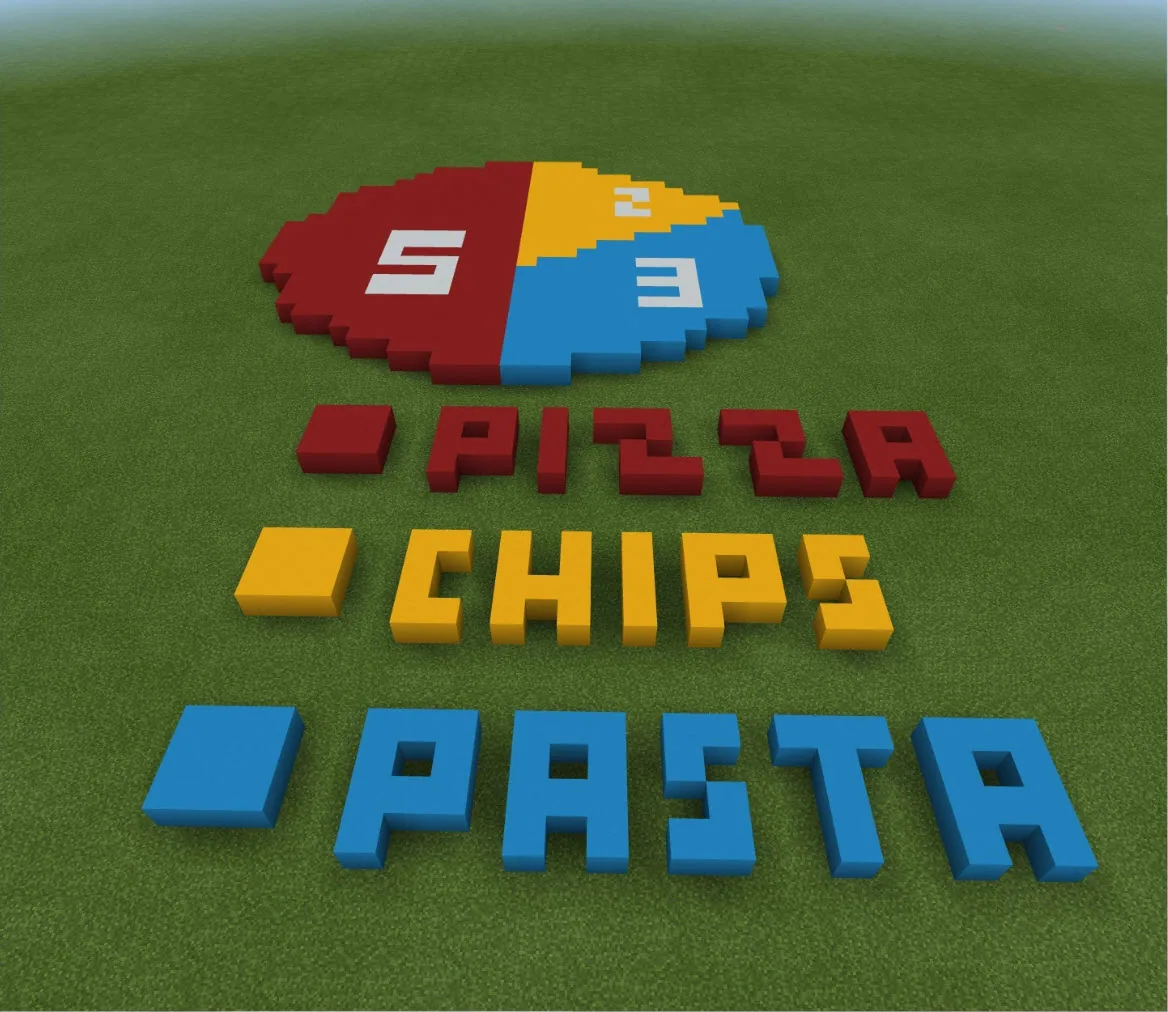
- The visual build in Minecraft represents one of the required formats: horizontal bar chart, line graph, or pie chart.
- The graph contains accurate labeling including a title, key, axes (if applicable), and numerical values or measurements.
- The visual scale and block counts accurately reflect the collected survey numbers.
Differentiation
Provide a structured tally chart template and guide learners to build a horizontal bar chart using three distinct block colors for simple category comparison.
Have students gather multi-location science measurements, such as temperatures across different rooms, and plot them as an interconnected line graph or multi-part pie chart.
Knowledge check
5 questions to check understanding after the lesson. Tap an answer to see if it is right; the score appears at the end.
1What is the minimum number of categories students must track in their class survey?
Answer: C. The activity instructions require students to use tally marks to track at least three categories.
2Which method are students instructed to use when tracking survey responses?
Answer: A. The student activities specify using tally marks to count responses during the survey.
3Which of the following is an authorized graph option for this assignment?
Answer: B. Students must select from a horizontal bar chart, a line graph, or a pie chart.
4What labeling components must students include where necessary on their graph?
Answer: C. Assessment criteria state that charts must include accurate labeling of keys, X and Y axes, titles, and numbers or measurements.
5Which of these is explicitly suggested as a science-related survey topic?
Answer: D. The lesson suggests science-related themes such as temperature in different classrooms or measurements.
Resources
- Lesson package (.zip)Everything the author attached to this lesson in one download.
- World FileA link to a sample Data World to begin your journey!
Frequently Asked Questions
What graph types are students allowed to construct?
Students must choose one format from three specific options: a line graph, a horizontal bar chart, or a pie chart.
Can students use science data instead of opinion polls?
Yes, while students may survey preferences like favorite colors or foods, they can also collect science data such as measurements or temperatures in different classrooms.
Does this lesson include a specific world to build in?
Yes, the lesson is designed to be used alongside a downloadable world file provided for the activity.
Adapted from Data World by Dean Garza on Minecraft Education, last updated Feb 28, 2025. This classroom version, the timings and the quiz were written by 9Minecraft Education.