- Type
- Lesson plan
- Ages
- Ages 11-13
- Duration
- about 65 min (suggested)
- Includes
- Quiz: 5 questionsLesson files
How can collecting and organizing game data help us identify patterns and communicate information clearly?
Overview
In this lesson, students discover how raw numbers gathered from hands-on observation can be organized into meaningful data sets. Working together, they learn the value of systematic tracking, frequency counts, and how clear records allow people to analyze patterns and plan next actions.
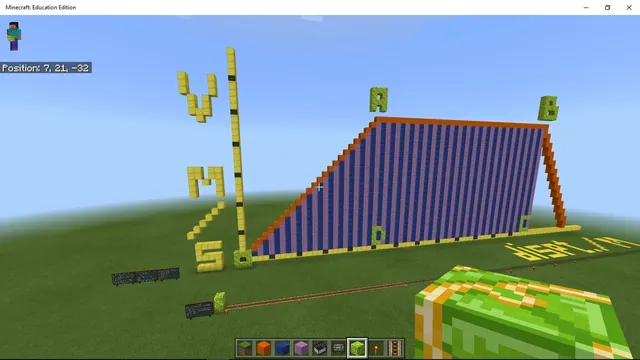
Using a survival world in Minecraft, learners hunt hostile creatures during a set night cycle to collect and log specific monster drops. They then combine individual records into shared frequency tables and construct visual, labeled graphs directly inside the game to interpret their findings.
Learning objectives
By the end of this lesson students will be able to:
- Collect numerical drop counts from defeated monsters using paper or digital tracking tools.
- Compile individual tallies into a structured group frequency table.
- Build a labeled visual representation or graph of the collected data inside Minecraft.
- Explain orally or in writing what the graphed data reveals about mob drops.
Blocks and items used in this lesson
 Rotten Flesh
 Gunpowder
 Bow
 Zombie
 Skeleton
 Creeper
Key vocabulary
- Data Set
- A collection of related numbers or facts gathered for a specific purpose.
- Frequency Table
- A chart showing how often each item or event occurs.
- Mob
- Any living entity or creature in Minecraft, such as a zombie or skeleton.
- Visual Representation
- A chart, graph, or physical model that displays data so it is easy to read.
Before class
Lesson sequence
Suggested timing: about 65 minutes in total.
- Preparation and Briefing10 min
Form student teams of two to four. Explain that teams must log every defeated monster and count each dropped item, such as rotten flesh, gunpowder, bows, and arrows, using paper or a digital document.
- Data Gathering Phase10 min
Set the world time to night using commands. Students venture out to battle hostile mobs across a ten-minute cycle, actively tallying the mob type and the quantity of items dropped per encounter.
- Data Sharing and Consolidation15 min
Have two to three small groups merge, or bring the entire class together into one large pool. Students combine their tallies into a unified table displaying mob name, item type, and drop frequency.
- In-Game Data Representation20 min
Teams spend up to twenty minutes constructing in-game bar charts, block graphs, or other creative visual displays representing their drop totals, ensuring all parts are clearly labeled.
- Discussion and Reflection10 min
Conduct a class debrief discussing what the collected numbers mean for a player, how probability shapes the game environment, and where similar data gathering occurs in real life.
Assessment: success criteria
- Student data log accurately tracks monster types and specific items dropped per encounter.
- Group data table combines individual tallies into an organized frequency record.
- In-game graph accurately represents compiled totals with clear labels.
- Student communicates verbally or in writing what their data display proves about monster drops.
Differentiation
Provide a pre-printed recording template with column headers for mob name, item type, and tally marks to help students track items quickly.
Challenge learners to calculate average drops per encounter or create alternative graph styles using unique block palettes to compare drop rates across multiple mob types.
Knowledge check
5 questions to check understanding after the lesson. Tap an answer to see if it is right; the score appears at the end.
1What event signals the start of the data collection phase?
Answer: A. The teacher changes the time to night using a command so hostile creatures will spawn for students to encounter.
2What specific information must students record during their monster hunts?
Answer: C. Students are instructed to track each kill along with the mob name, item type, and quantity of dropped materials.
3Why do students initially work in teams of two to four during data collection?
Answer: B. Working in small teams helps students survive encounters and increases the total number of mob kills for a larger data sample.
4What is the maximum recommended time students should spend building their in-game graphs?
Answer: C. The lesson instructions specify that learners should spend no more than 20 minutes building their visual data displays.
5What happens after the initial small groups finish collecting their drop information?
Answer: B. Two to three groups merge, or the whole class joins, to pool individual tallies into a larger compiled data set.
Resources
Frequently Asked Questions
What equipment should students have before leaving the starting area?
The teacher supplies each student with a full set of armor, a diamond sword, and a stack of food, either placed in chests or distributed using commands.
Can students use computers or tablets to record their tallies instead of paper?
Yes. The lesson permits either pen and paper or any digital recording tool to log kills and dropped items during the night cycle.
Adapted from Dangerous Data Sets by Garrett Zimmer on Minecraft Education, last updated Feb 2, 2017. This classroom version, the timings and the quiz were written by 9Minecraft Education.