- Type
- Build challenge
- Topics
- Math & EconomicsScience
- Duration
- about 60 min (suggested)
- Skills
- Critical thinking
- Includes
- Quiz: 5 questionsMinecraft world
How can collecting and pooling fishing data help us determine the probability of catching fish, junk, or treasure?
Overview
Probability is best understood through active sampling and data analysis. In this challenge, learners explore statistical likelihoods by collecting empirical data through repetitive trials, observing how random events behave across both individual and group data sets.
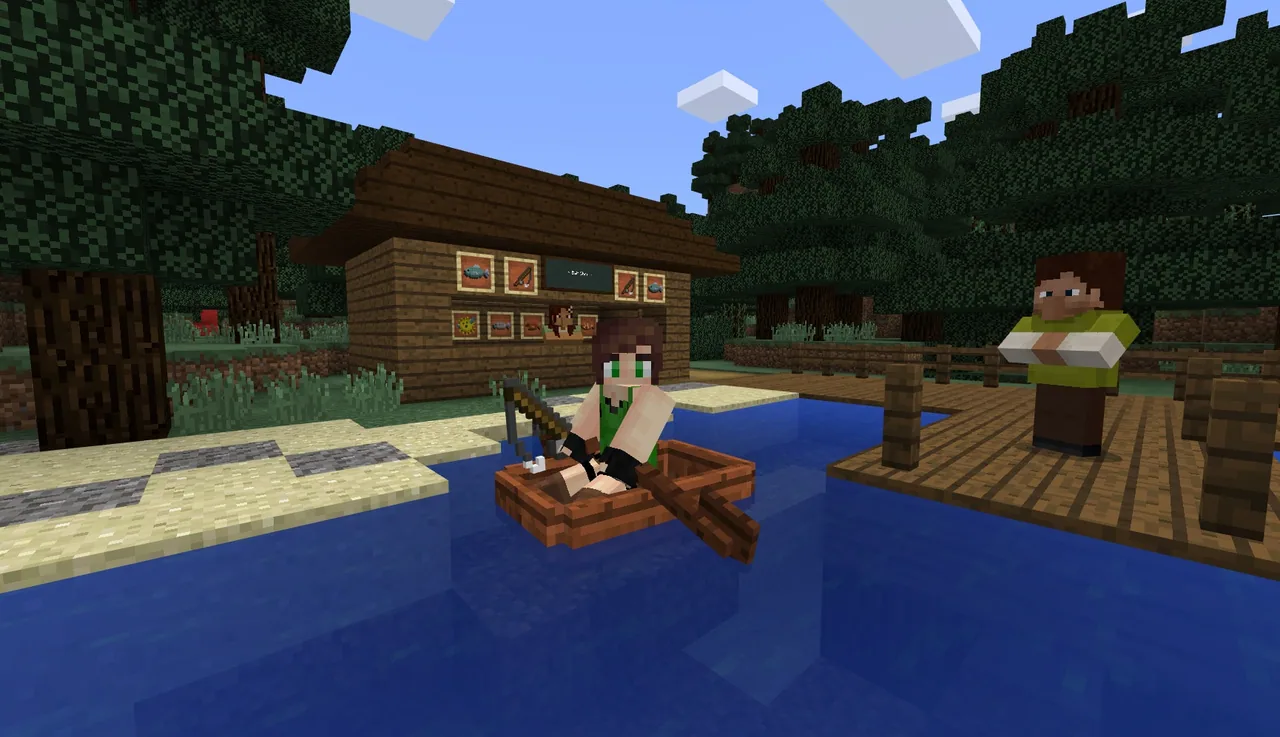
Using a fishing rod in a Minecraft aquatic environment, students record each catch they make. By pooling their results as a class, they classify their items into distinct outcome categories and calculate the mathematical chances of obtaining fish, junk, or treasure.
Learning objectives
By the end of this activity students will be able to:
- Record individual fishing results across multiple attempts in Minecraft.
- Categorize caught items into fish, junk, and treasure groups.
- Combine individual tallies into a shared class data set.
- Calculate the experimental probability of catching each category of item.
- Develop a testable hypothesis concerning variables such as weather or biome.
Blocks and items used in this lesson


Key vocabulary
- Probability
- The mathematical likelihood or chance that a specific event or outcome will occur.
- Data
- Facts, numbers, or tallies collected together for reference or analysis.
- Hypothesis
- A proposed explanation or testable prediction based on observed evidence.
Before class
Lesson sequence
Suggested timing: about 60 minutes in total.
- Introduction to Probability10 min
Introduce the concept of experimental probability and sampling. Explain that students will use fishing rods in Minecraft to test how often certain types of items appear.
- Data Collection Fishing20 min
Students head to the water with their fishing rods to catch items. Each student maintains a careful log, sorting every caught item into one of three categories: fish, junk, or treasure.
- Class Data Pooling and Analysis15 min
Gather the class to combine individual counts into a master data set. Using the total catches recorded across all students, calculate the probability of catching items from each category.
- Hypothesis and Extension15 min
Discuss how to express the resulting probabilities as fractions, decimals, and percentages. Encourage students to formulate hypotheses on whether variables like rain or different biomes alter these catch probabilities.
Assessment: success criteria
- Student accurately logs and tallies all items caught during the activity.
- Student correctly assigns caught items to fish, junk, or treasure categories.
- Student accurately calculates probability using the combined class data set.
Differentiation
Provide a pre-formatted tally sheet with visual item categories to help organize catch records.
Have students convert their calculated probabilities into fractions, decimals, and percentages, or set up an experiment testing weather effects on catch rates.
Knowledge check
5 questions to check understanding after the lesson. Tap an answer to see if it is right; the score appears at the end.
1What three categories of items do students track in this fishing challenge?
Answer: C. The challenge specifically directs students to categorize their catches into fish, junk, or treasure.
2Why do students combine their catch counts with their classmates?
Answer: A. Combining counts allows the class to compile a larger sample size to calculate statistical probabilities.
3Which core skill is listed as a focus for this challenge?
Answer: B. The challenge identifies critical thinking as the primary skill developed through the activity.
4Besides percentages, what other numeric formats can students use to represent probability in the extension?
Answer: B. The extension suggests expressing probability numerically as a fraction, decimal, and percentage.
5What environmental variable is suggested for students to test in a hypothesis?
Answer: A. The extension asks students to test whether weather or the type of biome affects what they catch.
Resources
Frequently Asked Questions
What subjects does this build challenge address?
This challenge integrates content from Math and Economics as well as Science through practical data gathering and statistical analysis.
Why is pooling data with the whole class helpful?
Individual students may encounter short-term variance, but combining class data provides a larger sample size that reveals more accurate statistical probabilities.
Adapted from Gone Fishing! by Minecraft Education on Minecraft Education, last updated Mar 4, 2025. This classroom version, the timings and the quiz were written by 9Minecraft Education.